Running a consignment store is different from running a standard retail shop—and your reporting has to reflect that reality. You’re not just tracking sales. You’re managing consignor payout tracking, split commission reporting, inventory that ages quickly, store credit balances, and seasonal trends that can make last month’s “top sellers” irrelevant overnight.
That’s why consignment store POS reporting can’t be an afterthought. The right reporting system helps you answer the questions that matter in real time:
- Which items are selling fast—and which are quietly expiring on the rack?
- What do you owe consignors right now (and what’s already been paid)?
- Are discounts protecting sell-through or eroding item-level profitability?
- Which categories deserve more floor space next month?
- How do returns, store credit, and payment mix affect cash flow?
This guide breaks down the POS reporting features every consignment store needs, the essential POS reports for consignment shops, and how to use consignment POS analytics and reporting features to make better decisions—without drowning in spreadsheets.
If you’re evaluating systems, you’ll also find a practical checklist for choosing the best POS reporting tools for consignment stores in 2026.
Why Consignment Stores Need Specialized POS Reporting

Consignment isn’t “retail with different inventory.” It’s a different operating model with different financial responsibilities. Traditional POS reporting usually focuses on sales totals, basic inventory counts, and high-level margin. Consignment stores need deeper visibility into ownership, liability, timing, and category velocity.
First, you’re selling inventory you don’t fully own. That means every sale triggers multiple downstream needs: split commission reporting, accurate payout calculations, and a reliable audit trail that keeps consignors confident.
If your POS can’t tie a receipt to a specific item, consignor, agreement terms, and payout status, you end up reconciling manually—and mistakes show up as distrust.
Second, consignment inventory ages. You’re carrying items with sell-by windows, expiration policies, seasonal relevance, and varying pricing potential. Without aging inventory reports, you’ll miss the moment where a small markdown could save a sale—or where holding out for full price is no longer realistic.
Third, store credit behaves like a financial obligation. Credits, returns, and exchanges can inflate sales if you only look at gross totals. Good reporting separates “activity” from “earned performance,” which protects you from false confidence.
Finally, rotating seasonal inventory creates fast-moving shifts in demand. The stores that win in 2026 aren’t the ones with the most inventory—they’re the ones that curate quickly using SKU-level reporting, category performance reports, and a disciplined weekly review cadence.
Pro Tip: If your current reporting can’t show sales by consignor and payout liability in the same place, you’re not just missing insights—you’re carrying hidden operational risk.
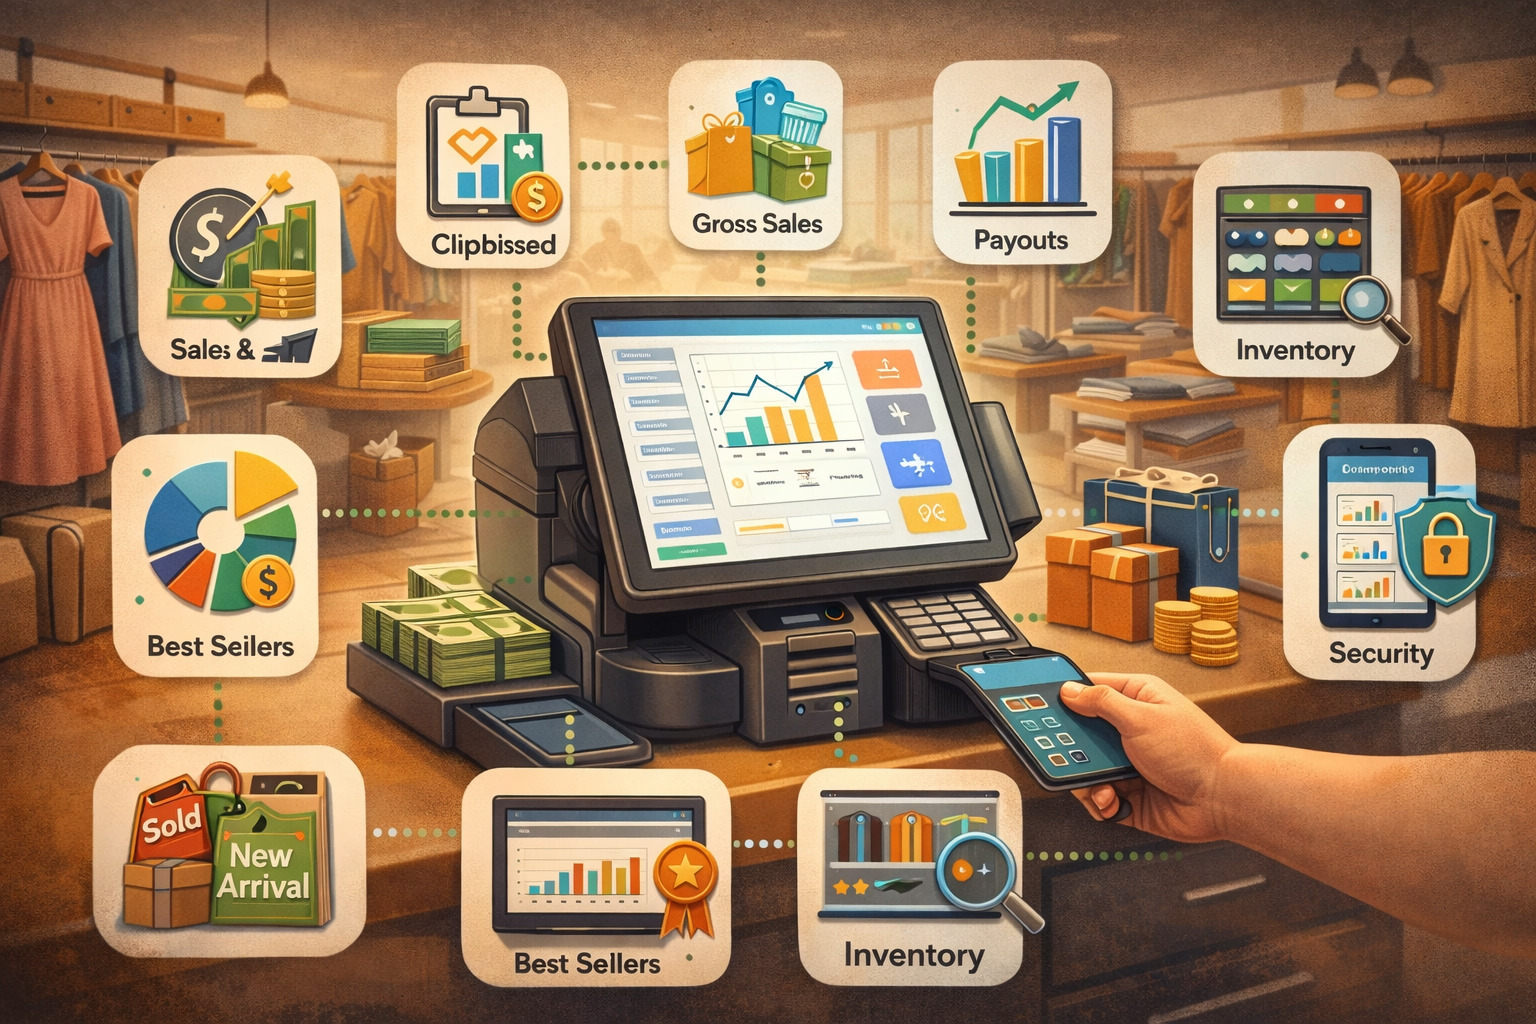
The Core Reports Every Consignment POS Should Include
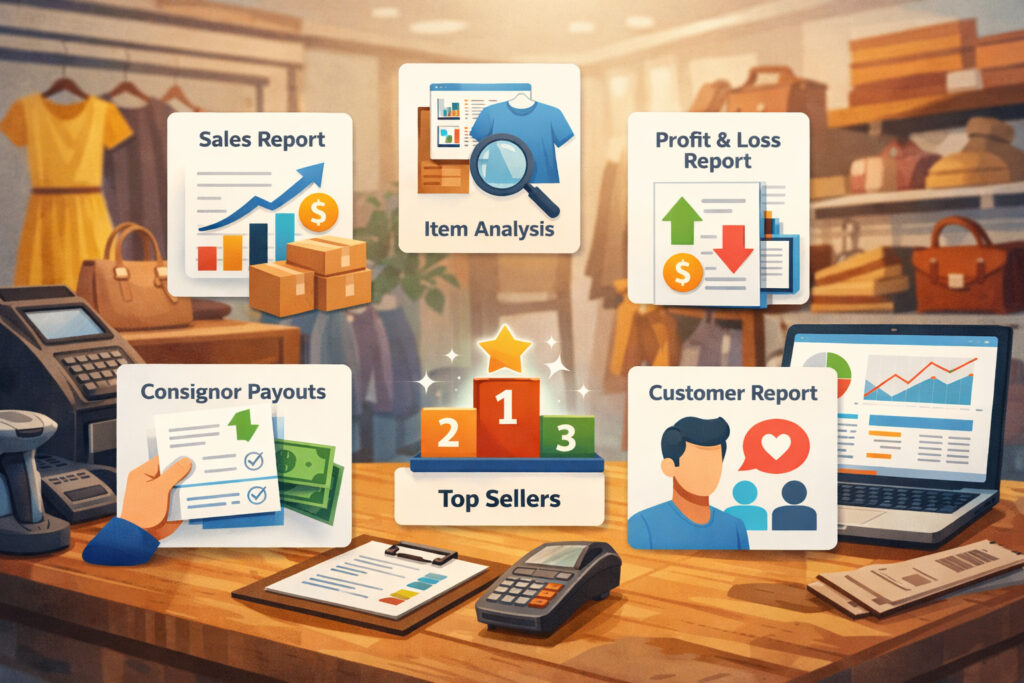
Most consignment shops don’t need hundreds of reports. They need a small set of essential POS reports for consignment shops that connect sales, payouts, inventory health, and cash flow. The key is that these reports must be accurate, easy to access, and filterable by time period, category, location, employee, and consignor.
Here are the categories that matter most:
- Sales performance reports (daily summary, category trends, payment mix)
- Consignor reports (sales by consignor, commissions, payouts, liabilities)
- Inventory intelligence (aging, sell-through rate, turnover, replenishment needs)
- Pricing and markdown reports (discount impact and recovery)
- Operations controls (returns, refunds, tax reporting, register reconciliation)
- Team reporting (employee performance reporting and behavior patterns)
To make this practical, use a POS that supports drill-down. “Category sales” is helpful, but “category sales + sell-through rate + average days to sell + markdown rate” is what drives decisions.
Table 1: Core POS reports for consignment stores
| Core report | What it shows | Why it matters |
|---|---|---|
| Daily sales summary | Gross sales, net sales, transactions, AOV, payment mix | Sets the daily baseline and flags issues fast |
| Sales by consignor | Itemized sales tied to each consignor | Builds trust and supports payout accuracy |
| Commission & payout report | Commission splits, payout totals, payout status | Prevents payout disputes and reconciliation chaos |
| Payout liability tracking | What you owe, by consignor and time period | Protects cash planning and reduces surprises |
| Inventory aging report | Items by age buckets and policy windows | Identifies slow movers before they become dead stock |
| Sell-through rate by category | Sold vs received per category over time | Guides buying/acceptance decisions and floor allocation |
| SKU-level reporting | Item-level sales, discounts, returns, time-to-sell | Reveals which exact items drive results |
| Item-level profitability | Margin after commission and discounts | Prevents “busy but unprofitable” selling |
| Markdown & discount analysis | Discount rate, markdown timing, recovery | Stops over-discounting and protects margin |
| Refund and return reports | Returns by category, employee, reason | Flags quality issues and policy gaps |
| Store credit tracking | Issued, redeemed, outstanding balances | Keeps liabilities visible and reduces leakage |
| Tax reporting | Tax collected by rate/category and period | Simplifies filing and reduces errors |
| Employee sales report | Sales, items processed, returns handled | Improves coaching and accountability |
| Cash vs card breakdown | Tender mix, cash drawer expectations | Helps reconciliation and loss prevention |
| Multi-location retail reporting | Consolidated + location comparisons | Enables consistent decisions across stores |
Pro Tip: A “payout report” is not enough by itself. You also need payout liability tracking (what’s owed but not yet paid) so your cash planning stays realistic.
Essential Sales Reports for Daily Control (and Fewer Surprises)
If you want better decisions, start with the reports that reduce uncertainty daily. A daily sales summary isn’t just a “how did we do?” snapshot. In a consignment environment, it’s a control panel: it helps you catch payout exposure, returns spikes, and tender mix changes before they become problems.
Your daily review should include:
- Gross sales vs net sales (after discounts and returns)
- Transaction count and average basket size
- Cash vs card breakdown to anticipate deposits and reconciliation needs
- Returns/refunds volume and reasons, where available
- Category performance to see what’s pulling demand today
What makes daily reporting valuable is trend context. A single strong day doesn’t mean much if it’s driven by heavy discounting or if returns are rising in a specific category. Likewise, a soft day can still be healthy if sell-through is improving and you’re reducing aging inventory risk.
Daily reporting also supports floor leadership. When managers can see category performance and returns patterns, they can adjust merchandising, reinforce policy at the register, and guide associates toward higher-quality intake conversations.
Pro Tip: Add one extra daily check: top 10 items sold and top 10 discounted items. It’s a quick way to spot “we only sold it because we marked it down,” which is a different story than true demand.
Consignor Reporting and Payout Accuracy

Consignment stores live and die by consignor trust. If your reporting makes payout confusing, delayed, or inconsistent, you’ll lose good inventory sources—even if your foot traffic is strong. That’s why sales by consignor, split commission reporting, and consignor payout tracking are not “nice to have.” They’re foundational.
A strong consignor reporting module should do four things reliably:
- Tie every item to a consignor profile (including intake date, terms, and identifiers).
- Apply the correct commission split automatically (including tiered splits if you offer them).
- Show payout status clearly (owed, scheduled, paid, held, expired, donated).
- Provide an audit trail that explains every number (sale price, markdowns, fees, taxes, and net payout).
Your internal team needs this for fast reconciliation. Your consignors need it to feel confident. Even if you don’t share full dashboards, you should be able to print or export a clear statement that matches the POS totals.
What “payout accuracy” really means in operations
Accuracy isn’t just “the payout is right.” It’s also:
- payouts posted to the correct period
- correct handling of returns after payout
- correct handling of store credit refunds
- clear treatment of expired items or policy-based deductions
- consistent rounding rules
Without this, payout disputes become recurring “investigations.” They waste time, stress staff, and create reputational drag.
Pro Tip: Use a weekly “payout exception report” that flags:
- items with missing consignor assignment
- sales with manual discount overrides
- returns on previously paid-out items
- negative consignor balances caused by policy gaps
Inventory Intelligence: Aging, Sell-through, and Turnover

Inventory reporting is where consignment stores can pull ahead quickly—because most stores still manage aging inventory by feel. In 2026, inventory turnover for consignment, aging inventory reports, and sell-through tracking should be a normal part of the weekly operating rhythm.
Sell-through rate (and why it’s more useful than “what sold”)
Sell-through rate tells you whether you’re curating well—not just whether you had a busy weekend. A simple, operational formula is:
Sell-Through Rate
Use this to measure how efficiently a category (or brand, rack, or consignor group) converts received items into sales.
Example: If you received 100 items and sold 60, your sell-through rate is 60%.
Use the same time window for both numbers (for example, last 30 days).
This metric becomes powerful when you segment it by:
- category
- price band
- brand tier (if you track it)
- intake source (walk-in vs appointment)
- seasonality
High sell-through categories deserve more intake focus and more floor space. Low sell-through categories may need tighter acceptance standards, different pricing guidance, or faster markdown schedules.
Inventory turnover (the “speed of money”)
Turnover helps you understand how quickly inventory converts into sales. In consignment, turnover isn’t just a finance concept—it’s a space management tool. Faster turnover means less crowding, better shopping experience, and fewer end-of-window write-offs.
To operationalize turnover, track:
- average days to sell by category
- percentage of items sold before markdown window
- percentage sold after first markdown
- percentage expired/unsold
Pro Tip: Build an “Aging by Value” view: aging items sorted not just by count, but by potential sales value. That’s where your biggest recoverable dollars usually sit.
Item-level profitability and margin after commission
Consignment can look profitable on paper while quietly leaking value through discounts, commissions, and returns. That’s why item-level profitability and margin reporting should reflect your actual economics, not generic retail gross margin.
A useful report should calculate:
- sale price
- discounts/markdowns
- fees (if any)
- commission amount
- your net revenue after commission
- tax handling (collected vs included)
- return impact (if returned)
Margin after commission (a practical definition)
In consignment operations, “margin” isn’t your cost of goods. It’s the share you keep. A practical way to think about margin after commission is:
(then factor returns separately in performance reporting)
This lets you compare categories fairly. Two categories may generate the same sales dollars, but one could have higher discount rates, slower sell-through, and more returns—making it less attractive despite the topline.
Item-level views also help you refine pricing rules. If a brand sells quickly at mid-price with minimal markdowns, your intake guidance can shift toward that sweet spot. If another brand only sells after deep discounts, you can tighten acceptance or shorten the markdown timeline.
Pro Tip: Watch “discount dependency”—the percentage of sales that occur at or below a certain markdown threshold. If dependency rises, your original pricing or intake quality needs attention.
Markdown and discount analysis that protects your margin
Discounting is normal in consignment. The problem is uncontrolled discounting—when markdowns become the default solution instead of a targeted strategy. A strong markdown and discount analysis report should answer three questions:
- When are we discounting? (age-based schedules vs manual overrides)
- What is discounting doing to sell-through? (does it actually move inventory?)
- What is discounting doing to profitability? (Are we protecting the net kept?)
You want visibility into:
- markdown timing (days from intake to first discount)
- discount rate by category
- discount rate by employee (manual overrides)
- recovery rate (how much of the original price you still captured)
- sell-through before and after markdown
Discount analysis also helps with consignor relationships. If consignors understand the markdown policy and see it applied consistently, they’re less likely to blame staff for “giving items away.” Consistency is a trust feature.
Pro Tip: Create a “manual markdown exceptions” report and review it weekly. If a few items are repeatedly discounted manually, your pricing rules may be too aggressive—or the floor presentation may be failing.
Returns, refunds, and store credit tracking
Returns are more complicated in consignment because they interact with consignor payouts, store credit balances, and tax handling. That’s why refund and return reports and store credit tracking must be built into your reporting cadence—not just pulled when there’s a problem.
Your returns reporting should include:
- returns count and value by category
- return reasons (if captured)
- return window adherence
- employee handling patterns
- returns tied to discounted items vs full price items
Store credit tracking should show:
- credit issued (by reason)
- credit redeemed
- outstanding credit liability
- credit age (how old the balance is)
- credit usage patterns (repeat customers vs one-time)
Why store credit reporting matters operationally
Store credit can inflate sales activity. A day with high redemption looks busy, but the cash impact is different than a day with fresh card payments. Tracking credit separately keeps the picture honest and helps you forecast cash needs for payouts.
Store credit also affects customer experience. If customers struggle to apply credit correctly or staff handle it inconsistently, you’ll see it as a spike in returns disputes or abandoned purchases. Good reporting surfaces those patterns.
Pro Tip: Review “returns by category” alongside “sell-through by category.” A category with high sell-through but rising returns may have quality issues, sizing confusion, or misaligned expectations at the register.
Tax reporting and reconciliation controls
Even well-run stores can lose hours each month to tax reconciliation if POS reporting isn’t clean. Your tax reporting should be simple, consistent, and auditable across date ranges. At minimum, your POS should provide:
- tax collected by period
- tax by rate (if multiple rates apply)
- taxable vs non-taxable sales (if relevant)
- returns/refunds impact on taxes
- tax overrides (and who performed them)
Reconciliation controls should connect the front end to the back end:
- register close-out totals (expected cash vs actual)
- cash vs card breakdown by day
- payout disbursements vs payout liability
- refunds processed vs inventory returned to stock
- store credit issued vs redeemed
These are not glamorous reports, but they prevent the slow erosion that happens when “small discrepancies” become normal.
Pro Tip: If you only run one control report daily, make it: net sales + tax + tender mix + refunds. It’s the fastest way to catch operational drift.
Employee performance reporting that improves consistency
In consignment, staff performance isn’t just about ringing sales. It includes intake quality, pricing discipline, policy adherence, and customer experience. Good employee performance reporting helps you coach behaviors—not just rank people.
Useful metrics include:
- sales and transactions per employee
- average discount rate per employee (manual overrides)
- returns handled per employee
- intake volume and acceptance rate (if your POS tracks intake)
- average time-to-sell for items processed by employee (advanced, but valuable)
The goal is consistency. If one associate has a much higher discount rate, it may signal training needs or confidence issues. If another has unusually high returns, it may indicate unclear explanations at checkout or rushed processing.
Employee reports also support scheduling. If category performance spikes on certain days and certain staff excel at merchandising or clienteling, you can build schedules around strengths.
Pro Tip: Don’t use employee reports as a “gotcha.” Use them as a weekly coaching tool with one focus metric at a time (discount discipline, return prevention, intake accuracy).
Real-time POS dashboards and alerts
Static reports are useful, but consignment stores benefit hugely from real-time POS dashboards and alerts that reduce reaction time. In 2026, dashboards should not just show sales totals—they should highlight exceptions and risks.
A practical dashboard for a consignment manager should include:
- current-day sales vs same weekday trend
- top categories today
- returns/refunds today
- current payout liability (or a daily estimate)
- aging inventory alerts
- low-stock and reorder alerts (for non-consigned essentials like bags, tags, supplies)
Alerts that actually matter in consignment
Set alerts that connect directly to actions:
- Low-performing items: items with high views/handling but no sales (if tracked), or items older than X days with no markdown.
- Items nearing expiration window: flags by age bucket so staff can pull, reprice, or relocate.
- High-return categories: alerts when return rate crosses your normal range so you can check quality and signage.
Dashboards are only helpful if someone owns them. Assign a manager to review alerts twice daily and take simple actions: pull a rack, adjust a display, or review a category’s pricing.
Pro Tip: Keep dashboards “decision-ready.” If your dashboard needs multiple clicks just to answer “what should we do next,” it’s not doing its job.
Multi-location reporting and scalability
As soon as you operate more than one location—or even a small satellite intake point—reporting complexity multiplies. Multi-store success depends on multi-location retail reporting that supports standardization while respecting local differences.
Your POS should support:
- consolidated reporting across all locations
- location comparison reports (sales, sell-through, returns, discount rate)
- shared consignor profiles (if your model requires it)
- consistent category definitions and SKU structures
- location-level payout liability tracking
What to compare across locations (and what not to)
Compare metrics that indicate operational health:
- sell-through rate by category
- average days to sell
- markdown rate
- return rate
- net kept after commission (where available)
Be careful comparing raw sales totals without context. One location may have higher foot traffic but lower item-level profitability due to deeper discounting. Another may be smaller but more curated and efficient.
Multi-location reporting also supports inventory movement strategies. If one store has slow movement in a category and another sells that category quickly, reporting can justify transfers (if your model allows it) or shift intake focus.
Pro Tip: Standardize category and SKU rules first. Multi-location reporting is only as good as your underlying data consistency.
How reporting improves profitability (without guessing)
Reporting doesn’t make money by itself. It improves profitability by making decisions less emotional and more repeatable. The clearest gains typically come from four areas:
Smarter pricing
When you use SKU-level reporting and item-level profitability views, you can refine pricing rules based on what actually sells at what price—reducing discount dependency and increasing net kept.
Better consignor relationships
Consistent sales by consignor statements and accurate payout reporting reduce disputes and strengthen retention. Better consignors bring better inventory, which drives higher sell-through.
Inventory curation decisions
Category performance reports and aging insights help you accept the right items, decline the wrong ones, and rebalance floor space based on demand—not habit.
Staff performance optimization
Employee reports reveal where training will produce real results: fewer returns, fewer manual markdowns, and better intake accuracy.
Pro Tip: If you’re only using reports to “look back,” you’re missing the value. The best reporting systems help you decide what to do today—pull, reprice, promote, or pause intake in a category.
Common reporting mistakes (and how to fix them)
Many consignment stores “have reports” but don’t get value because of predictable mistakes. Fixing these usually delivers immediate operational clarity.
Mistake 1: Not reconciling payouts
If payouts are processed without a tight link to sales and returns, errors compound. Fix: run weekly payout reconciliation that checks payout liability vs payouts issued, and flags exceptions.
Mistake 2: Ignoring aging inventory
Aging inventory doesn’t announce itself. It quietly steals space and attention. Fix: weekly aging review with clear actions (reprice, relocate, bundle, pull for donation).
Mistake 3: Over-discounting slow sellers
Discounting can become a reflex. Fix: require markdown reasoning or limit manual overrides; review discount analysis weekly.
Mistake 4: Treating gross sales as “performance”
Gross sales can hide return activity, store credit redemption, and deep discounting. Fix: track net sales and net kept after commission alongside gross.
Mistake 5: Inconsistent categories and SKUs
If items aren’t categorized consistently, your category performance reports lie. Fix: standardize category definitions and enforce them at intake.
Pro Tip: Your reporting is only as good as your intake data. Train intake staff like they’re entering financial information—because they are.
How to choose the best POS reporting tools for consignment stores
If you’re evaluating platforms, reporting should be one of your primary filters. The best POS reporting tools for consignment stores don’t just provide charts—they provide consignment-specific accountability: payouts, splits, and item-level clarity.
Use this must-have checklist when assessing tools:
- Consignor profiles with history and searchable activity
- Split commission reporting (including tiered rules)
- Consignor payout tracking with payout status and audit trails
- Sales by consignor with item-level detail
- Inventory aging reports with customizable age buckets
- Sell-through and turnover tracking by category
- SKU-level reporting with discounts and returns tied to each item
- Item-level profitability after commission and markdowns
- Store credit tracking (issued, redeemed, outstanding)
- Robust return/refund reporting with reason codes (optional but helpful)
- Export options (CSV/Excel) and accounting integrations
- Custom report builder or flexible filtering
- Role-based access and audit logs for overrides
- Multi-location retail reporting with consolidation
Exports and accounting integration: what “good” looks like
Exports should preserve relationships—item to consignor, sale to payout, payout to payment method. If exporting breaks those links, you’ll spend time rebuilding data in spreadsheets.
Custom report building matters if your model is unique (different split rules, special events, pop-ups, or seasonal intake policies). Even without a full builder, strong filters are essential.
Pro Tip: During demos, ask for one live walkthrough: “Show me a payout report, then click into a consignor, then click into an item, and show me the discount and return history.” If they can’t do that smoothly, reporting will frustrate you later.
KPI benchmarks to monitor (directional targets, not hype)
You don’t need “perfect” numbers. You need consistent definitions and directional goals that fit your store model. Below are practical KPIs for consignment POS analytics and reporting features—with directional targets that you can tune based on your category mix and pricing strategy.
Table 2: KPI benchmarks to monitor
| KPI | What it indicates | Directional target |
|---|---|---|
| Sell-through rate (by category) | Curation quality and demand match | Trend upward over time |
| Average days to sell | Inventory speed and space efficiency | Trend downward for core categories |
| Markdown rate | Discount dependence | Trend downward while maintaining sell-through |
| Net kept after commission | Real performance beyond gross sales | Trend upward and stable |
| Return rate (by category) | Quality/policy clarity issues | Stable or trending downward |
| Store credit outstanding | Liability and customer behavior | Stable with controlled growth |
| Payout liability | Cash planning health | Predictable and reconciled weekly |
| Sales by consignor concentration | Reliance on a few consignors | Balanced over time |
| Category contribution | What truly drives performance | Clear “core categories” emerge |
| Cash vs card breakdown | Reconciliation and cash handling | Stable with explainable shifts |
Pro Tip: Track trends, not one-off results. A single promotional weekend can distort KPIs—your goal is stable improvement across normal weeks.
Reporting needs by store size (so you don’t overbuild)
The right reporting stack depends on your scale. A small shop can be high-performing with a tight set of dashboards and weekly routines. A growing store needs more segmentation. Multi-location operators need governance.
Table 3: Reporting needs by store size
| Store stage | What matters most | Reporting priorities |
|---|---|---|
| Small shop | Control, payout accuracy, fast inventory movement | Daily sales summary, sales by consignor, payout report, aging, basic discount analysis |
| Growing store | Consistency, category strategy, staff coaching | Sell-through by category, item-level profitability, returns analysis, employee reporting, store credit tracking |
| Multi-location | Standardization, comparisons, consolidated visibility | Consolidated reporting, location comparisons, standardized SKU/category reporting, location-level payout liability, dashboards and alerts |
Pro Tip: Start simple, then add complexity only when a decision requires it. Reporting should reduce work, not create it.
Sample reporting workflows: daily, weekly, monthly
You’ll get the most value from reporting when it’s tied to routines. Below are simple cadences that work for most consignment operations.
Daily workflow (10–15 minutes)
- Review daily sales summary (gross vs net)
- Check cash vs card breakdown and refunds
- Look at top categories and top discounted items
- Scan aging inventory alerts (items nearing policy windows)
- Spot-check store credit tracking activity
Pro Tip: Assign one daily “action”: pull a slow category display, reprice a rack, or clarify signage for a high-return category.
Weekly workflow (60–90 minutes)
- Run sales by consignor and payout exception checks
- Review commission and payout report + payout liability tracking
- Review sell-through rate by category and price band
- Audit markdown and discount analysis, especially manual overrides
- Check returns and refunds by category and employee
- Review employee performance reporting for coaching themes
Pro Tip: Weekly is where most improvement happens. Daily keeps you stable; weekly makes you better.
Monthly workflow (2–3 hours)
- Compare month-over-month category performance reports
- Evaluate intake standards using sell-through and aging outcomes
- Review seasonal sales trends to plan merchandising shifts
- Audit store credit liability aging
- Confirm tax summary and reconciliation controls
- If applicable, run multi-location retail reporting comparisons
Pro Tip: Use the monthly review to adjust policies (markdown timelines, intake guidelines, return rules) based on evidence—not frustration.
30/60/90-day reporting optimization plan
If your reporting currently feels messy or underused, don’t overhaul everything at once. Use a structured 30/60/90-day plan that builds confidence, consistency, and decision quality.
Days 1–30: Establish baseline metrics and clean data
- Standardize categories and SKU rules for intake
- Ensure every item is tied to a consignor correctly
- Define your core KPIs (sell-through, aging, returns, discount rate, payout liability)
- Set up dashboards: daily sales, returns, aging alerts
- Build one weekly reconciliation process for payouts
Deliverable by day 30:
- a reliable weekly payout reconciliation
- consistent category reporting
- baseline KPI snapshots for the last 4 weeks
Pro Tip: Don’t chase advanced analytics until your item data is clean. Garbage in will waste your time.
Days 31–60: Refine pricing and markdown strategy
- Use SKU-level reporting to identify discount dependency
- Adjust pricing guidance by category and price band
- Set or refine markdown schedules based on aging performance
- Review category sell-through and tighten intake criteria where needed
- Implement exception reporting for manual discounts
Deliverable by day 60:
- an updated pricing/markdown playbook
- weekly discount exceptions review
- measurable improvement in aging inventory buckets (directionally)
Pro Tip: Aim for fewer manual overrides. When staff discount less manually, your pricing rules are usually improving.
Days 61–90: Optimize consignor strategy and staff KPIs
- Identify top-performing consignor profiles and replicate the pattern
- Use sales by consignor concentration to reduce dependency
- Set staff coaching KPIs: intake accuracy, discount discipline, return prevention
- If growing, prepare multi-location reporting standards (even before expansion)
Deliverable by day 90:
- a consignor performance framework
- staff scorecard metrics you review weekly
- a quarterly reporting calendar and owners for each review
Pro Tip: The best systems combine metrics with habits. Reporting only works when someone owns the routine.
FAQs
Q.1: What reports does a consignment store POS need?
Answer: At minimum, you need a daily sales summary, sales by consignor, commission and payout reporting, payout liability tracking, inventory aging reports, sell-through by category, markdown analysis, returns/refunds, store credit tracking, tax summary, and employee performance reporting. These cover the operational realities unique to consignment: shared revenue, time-sensitive inventory, and liabilities.
Q.2: How do I track consignor payouts accurately?
Answer: Use a POS that ties every sale to the original item record and consignor profile, applies split commission rules automatically, and maintains a payout status (owed, scheduled, paid).
Pair that with a weekly payout reconciliation process that checks payout liability against payouts issued and flags exceptions like returns after payout.
Q.3: What is the sell-through rate in a consignment store?
Answer: Sell-through rate measures how much of the inventory you take in actually sells in a given period. A practical formula is (Units Sold ÷ Units Received) × 100, using the same date range for both. Tracking by category helps you improve intake standards and pricing.
Q.4: How do aging inventory reports work?
Answer: Aging reports group inventory by how long it has been in the store (for example, 0–14 days, 15–30 days, 31–60 days, and so on). In consignment, you use these buckets to trigger actions like first markdowns, display changes, or end-of-window decisions.
Q.5: Can POS reports help reduce overstock?
Answer: Yes. Sell-through rate, inventory turnover, and aging reports help you identify categories where intake is outpacing demand. With that insight, you can tighten acceptance standards, adjust pricing guidance, or shift floor space toward faster-moving categories.
Q.6: How often should I review POS reports?
Answer: Review a short set daily (sales, tender mix, refunds, aging alerts), a deeper set weekly (payouts, sell-through, markdowns, returns, staff patterns), and strategic trends monthly (seasonal sales trends, category shifts, policy adjustments). The cadence matters as much as the reports.
Q.7: What’s the best way to track store credit?
Answer: Use store credit tracking that shows issued, redeemed, and outstanding balances—plus age of credits. Separate store credit redemption from fresh sales in daily reporting so you understand both customer activity and cash impact.
Q.8: Can POS reporting improve consignor retention?
Answer: Yes. Consignors stay when payouts are accurate, timely, and explainable. Clear sales by consignor statements, consistent commission application, and transparent payout tracking reduce disputes and build confidence—especially with high-quality consignors.
Q.9: Do I need advanced analytics for a small consignment shop?
Answer: Not necessarily. Many small shops do well with a focused set of reports and strong habits: daily sales controls, weekly payout reconciliation, and weekly aging + sell-through reviews. Advanced analytics becomes more valuable as your volume and complexity grow.
Q.10: How do I compare multi-location performance?
Answer: Use consolidated reporting and location comparison reports that focus on operational health metrics: sell-through, days to sell, markdown rate, return rate, and net kept after commission. Avoid judging solely on gross sales without context.
Q.11: What is payout liability tracking and why does it matter?
Answer: Payout liability tracking shows what you owe consignors based on sold items that have not yet been paid out. It matters because it affects cash planning, prevents surprise payout crunches, and creates a clean operational audit trail.
Q.12: How do I identify low-performing items quickly?
Answer: Use dashboards and alerts that flag items past key aging thresholds, items with multiple markdowns, or items in categories with falling sell-through. Pair this with SKU-level reporting to find patterns in pricing, brand tiers, or intake sources.
Q.13: How do returns affect consignor payouts?
Answer: Returns can create complexity when they occur after payouts are issued. Your POS should track return impact at the item and consignor level and support policies for handling negative balances or future payout offsets where needed.
Q.14: What should I look for in a custom report builder?
Answer: Look for filters and grouping that match your workflow: by consignor, category, age bucket, employee, and location—plus the ability to export without losing item-to-consignor relationships. The best custom tools reduce spreadsheet clean-up.
Conclusion
Consignment stores succeed when they curate well, sell inventory fast, and maintain trust with consignors and customers. The right reporting turns those goals into daily and weekly actions.
In 2026, the winners aren’t the stores with the most complex dashboards—they’re the stores that consistently use the POS reporting features every consignment store needs to keep inventory healthy, payouts accurate, and decisions evidence-based.
When evaluating consignment store POS reporting, focus on the essentials: item-level visibility, payout clarity, inventory aging intelligence, and decision-ready dashboards. That’s the foundation of the best POS reporting tools for consignment stores—and it’s what makes reporting feel like a helpful manager instead of another chore.